Graphy for Data Storytelling
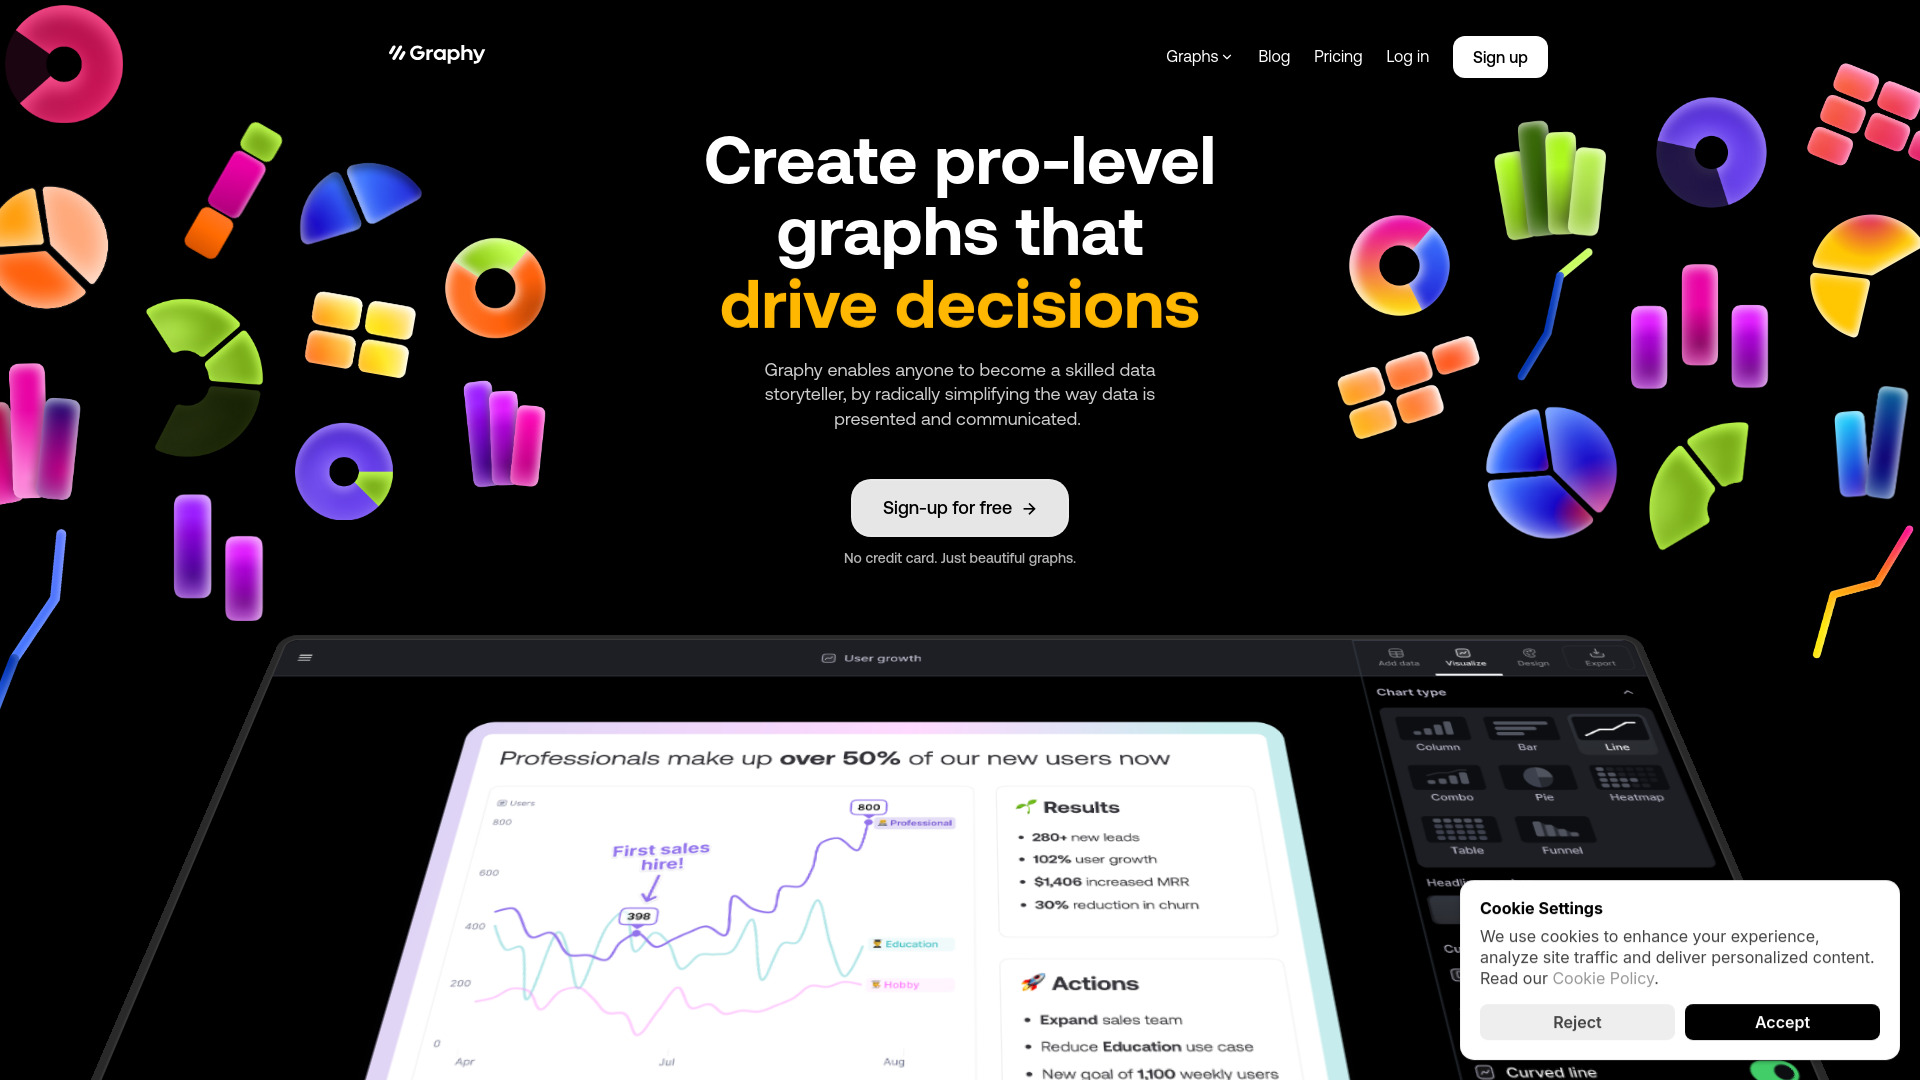
Create pro-level graphs for effective data storytelling and decision making.
Free
5.0
What is Graphy for Data Storytelling?
Graphy is a data visualization tool that simplifies the creation of professional graphs and charts, enabling users to communicate insights effectively and drive decisions with their data.
About
Create pro-level graphs for effective data storytelling and decision making.
How to Use Graphy for Data Storytelling
To use Graphy, sign up for free, connect your data sources, and utilize the intuitive interface to create beautiful, actionable graphs.
Frequently Asked Questions
Is Graphy free to use?
Yes, Graphy offers a free plan with no credit card required.
What data sources can I connect to Graphy?
You can connect Google Sheets and paste data from various sources to create graphs.
Quick Info
- Company
- Graphy Technologies Ltd.
- Pricing
- free
- Platforms
- website
Best For
- Visualize data for reports and presentations
- Collaborate in real-time with teams
- Create graphs for social media and newsletters
Tags
#Data visualization#Graphs#AI-generated insights#Collaboration#Interactive charts#Data storytelling